
🚀 OI Tech Gamazone Live OI Dashboard — Nifty Options Chain Intelligence Guide Powered by StockAiVerse | Centroid Engine & Strike Ladder
-
🚀 OI Tech Snapshot The OI Dashboard is the sharpest real-time intelligence tool available to intraday Nifty options traders. Rather than lagging behind price like traditional indicators, this dashboard reads the raw order flow written directly into Open Interest — giving you an unfiltered view of where institutional money has placed its bets, where the invisible walls sit, and what the real breakout band looks like. If you trade Nifty options intraday and you rely on indicators alone, you're flying blind. This tool changes that.
-
✨ What It Shows — Core OI Intelligence The dashboard is structured around five core intelligence layers. Here is what each reveals:
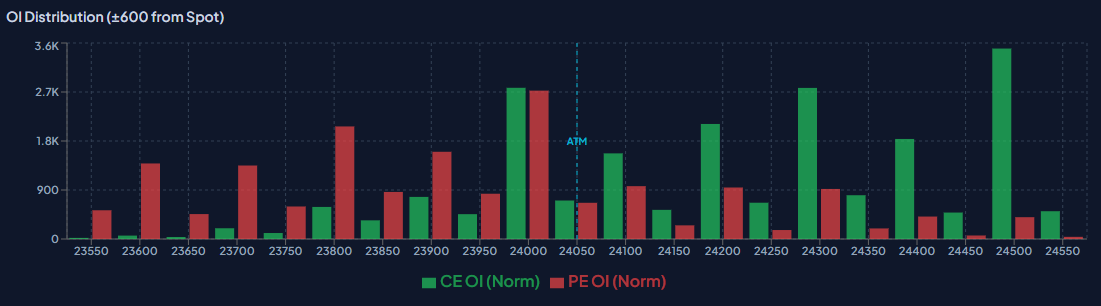
2.1 OI Distribution Chart (±600 from Spot)
The bar chart shows normalized CE (green) and PE (red) Open Interest across strikes within ±600 points of spot. This is the most visual representation of where open positions are concentrated. Thick green bars above spot = resistance. Thick red bars below spot = support. When both sides compress near ATM, you are looking at a coiled spring ready to snap.
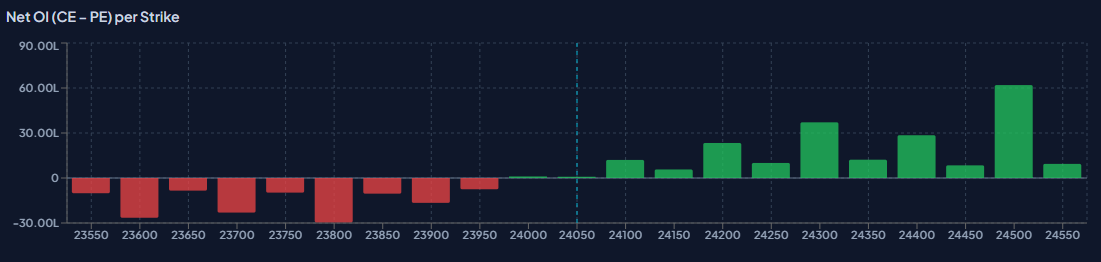
2.2 Net OI (CE − PE) per Strike
This chart strips away the noise and shows the net directional bias at every strike. Positive bars = more call writing (bearish pressure at that strike). Negative bars = more put writing (bullish support at that level). The shift in net OI across time snapshots tells you whether smart money is adding conviction or quietly unwinding.
2.3 Gamma Compression Reading
📍 Current Reading: COMPRESSION HIGH — 73.8% of total OI is clustered within ±200 of ATM (24000). Breakout Zone: 23800 ↔ 24200.

Gamma Compression is the single most important structural read on any expiry day. When a high proportion of OI is pinned near ATM, market makers are forced to delta-hedge aggressively once price moves out of that band. The result is an explosive, directional move once the compression breaks — not a slow grind.
2.4 CE & PE Wall Ladder (Strike Ladder)
The wall tables classify significant OI clusters by type — L1 (strongest layer), L2 (second layer), and Fresh (new buildup). CE walls above spot define resistance clusters. PE walls below spot define dynamic support floors. The COI (Change in OI) column shows whether positions are being freshly added or are already aged — fresh COI = live conviction.
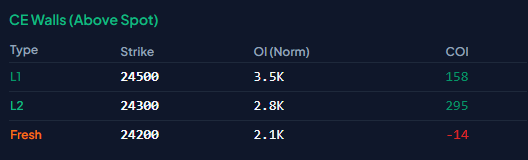
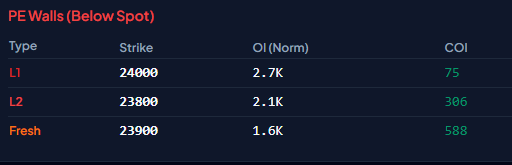
CE Walls (Above Spot) Type Strike OI (Norm) COI L1 24100 17061 13573 L2 24000 16639 13975 Fresh 24050 15001 13912 PE Walls (Below Spot) Type Strike OI (Norm) COI L1 23900 12264 8816 L2 23950 11847 10165 Fresh 23500 7316 7316
-
🔥 Why You'll Love It — Key Trading Edges • You get to see the exact strikes where institutional writers have placed their heaviest bets — before price even touches those levels. • This lets you distinguish between a genuine breakout and a fakeout engineered to trap breakout buyers. • You get to map dynamic support and resistance that updates with every OI snapshot — not static lines drawn at yesterday's close. • This lets you gauge directional conviction in real-time: rising COI at a wall = wall is strengthening; falling COI = wall is melting. • You get to time entries around gamma compression releases — the highest-velocity intraday moves come from coiled OI structures. • This lets you avoid the most common trap: buying a breakout that reverses the moment ATM options writers defend their position. • You get to correlate PCR skew with price action to confirm whether the broader trend has institutional backing or is running on retail momentum.
-
📋 How to Read It — Step-by-Step
-
Start with the Gamma Compression reading. Is compression HIGH, MODERATE, or LOW? High compression means the market is coiled and a sharp move is due once ATM OI is cleared. Note the breakout band.
-
Identify the nearest CE and PE walls. L1 CE wall above spot = first resistance to clear. L1 PE wall below spot = first support floor. These are your immediate battleground levels.
-
Check the COI column on both walls. High COI = fresh writing, wall is defended. Low COI = old positions, wall may crumble on pressure. Fresh buildup at a new strike = watch for a new wall forming.
-
Read the Net OI chart for directional skew. Consistent positive bars above ATM = call writers dominating = ceiling in place. Consistent negative bars below ATM = put writers active = floor in place.
-
Use snapshot comparison (J1 vs J2) to track migration. If the OI centroid has migrated upward between the anchor and the latest snapshot, bulls are gaining ground. A downward migration signals bears taking control.
-
Execute only in the direction of confirmed OI structure. Never enter against the L1 wall unless the COI has dropped significantly. Wait for price to close outside the breakout band with OI confirmation before assuming a trend is established.
-
💡 High-Probability Intraday Use Cases
Use Case 1: Gamma Squeeze Entry at Breakout Band When Gamma Compression is HIGH and price approaches the edge of the breakout band (e.g., 24200 on the upside), watch for the L1 CE wall's COI to start dropping sharply. This signals that call writers are being forced to cover rather than add. As the wall melts, the OI vacuum above creates a velocity move — enter long on a close above the band with momentum, targeting the next structural wall.
Use Case 2: Fakeout Identification at ATM Price spikes through ATM to test a CE wall but the OI Distribution shows no reduction in CE OI at that strike — and the Net OI chart remains strongly positive. This tells you writers are not covering; the spike is a fakeout designed to trigger stop-loss orders above the level. Fade the breakout confidently and position for a reversion to the OI centroid.
Use Case 3: PE Wall Bounce — Precision Support Entry Price pulls back to the L1 PE wall (e.g., 23900) and the COI on that wall is high and rising. Fresh put writing means institutional support is actively being defended. Rather than waiting for a lagging indicator crossover, you can enter long at the wall with a tight stop just below, knowing exactly where the structural floor sits.
Use Case 4: OI Centroid Migration Trend Trade Across multiple intraday snapshots, the OI centroid (the weighted average of OI concentration) shifts progressively upward. This means options writers are migrating their heaviest positions to higher strikes — they expect price to stay below a higher ceiling. Use centroid migration as a trend confirmation tool: trade in the direction of migration until a snapshot shows the centroid stalling or reversing.
Use Case 5: PCR Extreme + Wall Confluence = High-Conviction Reversal When PCR drops to an extreme low (heavy call OI relative to put OI) AND price is pressing against the L1 CE wall with no COI reduction, the probability of a reversal is high. Combine the PCR skew signal with the wall COI data for a high-confidence fade setup. Exit if the wall's COI begins to collapse, signalling genuine absorption.
-
🌟 What Makes This OI Tool Special Unlike RSI, MACD, or moving averages — which are derivatives of price — OI is the source data. It tells you where traders have committed real capital. The StockAiVerse dashboard's Gamma Compression engine quantifies exactly how tightly coiled the market is at any given moment — a metric no conventional charting tool provides. The heatmap-style OI Distribution makes the invisible order book visible at a glance, while the centroid engine gives you a single number to track institutional positioning migration across the session. The result is a dashboard that reads market intent, not market reaction.
-
Next Steps 📍 Ready to apply? Upload your own OI dashboard screenshot or PDF and ask: "Give me the tech view" — the OI Tech Explainer will map every section, explain the live structure, and walk you through actionable intraday setups based on the current OI configuration.
Want to go deeper? Drop a specific section — PCR, centroid, Net OI, or wall ladder — and ask for a drill-down. Or share your current Nifty price action chart alongside the OI dashboard and get a live correlation of price structure with OI intelligence.
— OI Tech Explainer | StockAiVerse —