

OI TECH OI VIEWER TOTAL OI
Nifty Options Chain Open Interest Dashboard
StockAiVerse | Live OI Dashboard | Centroid Engine & Strike Ladder
1. OI Tech Snapshot
The Live OI Dashboard from StockAiVerse is a purpose-built intelligence layer for serious Nifty options traders. It aggregates real-time Open Interest data across strikes, synthesises it through proprietary centroid and heatmap engines, and delivers a single unified view of where significant option positioning is concentrated — and how it changes intraday.
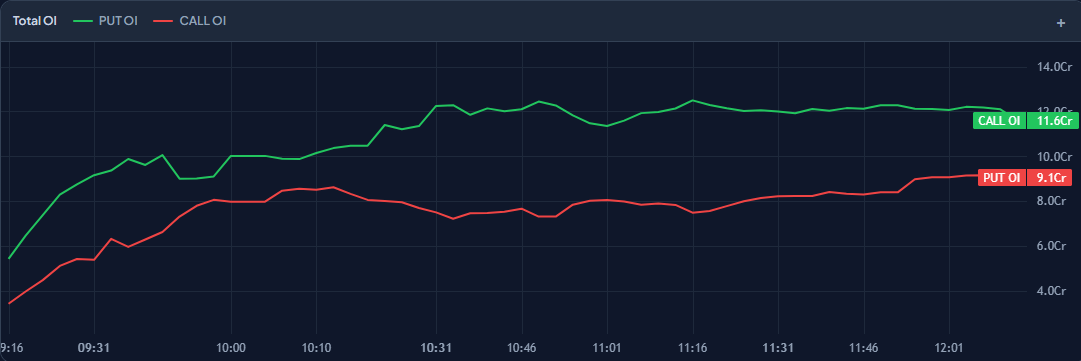
This tool is built for sharp intraday traders who refuse to trade price alone and want to interpret evolving market positioning through OI flows. Unlike lagging price indicators (moving averages, RSI), this dashboard helps traders monitor real-time OI changes and positioning shifts alongside price action.
2. Current Dashboard Snapshot
Below is a summary of the key metrics from today's live OI dashboard reading:
CE Centroid 24,746.56 Weighted centre of call-side OI concentration — potential resistance reference zone.
PE Centroid 23,259.51 Weighted centre of put-side OI concentration — potential support reference zone.
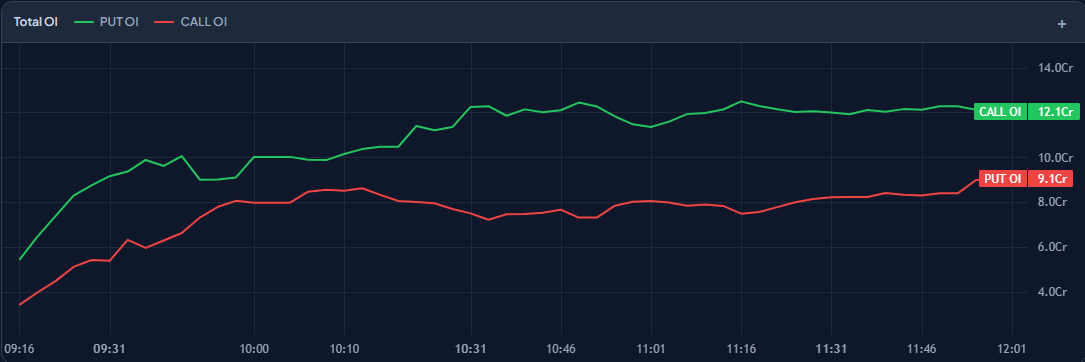
Centroid Spread 1,487 pts Estimated range derived from current centroid positioning Centroid Strength 29 / 100 Low conviction — market can flip direction rapidly Signal BEARISH Current OI positioning shows relatively stronger call-side concentration above spot. Spot / ATM 24,109.55 / 24,100 Current market price vs nearest strike PCR (OI) 0.977 NEUTRAL — right on the fence; use centroid and heatmap readings alongside price action for additional context.
3. Core OI Intelligence — What It Shows
3.1 OI Centroid
The OI Centroid computes a weighted average of all CE (Call) and PE (Put) open interest across active strikes.
• CE Centroid marks the weighted concentration zone of all call writing
• PE Centroid marks the same for puts
• The spread between them can help estimate the current positioning range.
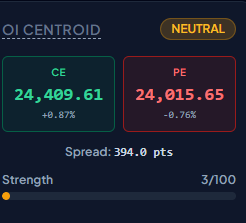
Current Reading (27 Apr 2026) CE Centroid: 24,746.56 | PE Centroid: 23,259.51 | Spread: 1,487 pts Strength: 29/100 (WEAK) | Signal: BEARISH Call-side OI concentration remains stronger above spot, which may act as resistance if sustained; Put-side support appears comparatively lighter in the current structure.
3.2 OI Heatmap — The Strike Ladder
The Heatmap is the strike-by-strike OI distribution table. Heavy CE OI at a strike may indicate potential resistance, while heavy PE OI may indicate potential support.
Spot: 24,109.55 ATM: 24,100
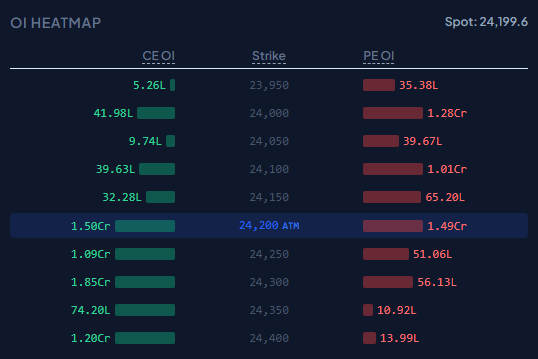
CE OI (Resistance) | Strike Price | PE OI (Support)
3.70L | 23,850 | 28.53L
14.22L | 23,900 | 74.08L
7.22L | 23,950 | 38.14L
60.75L | 24,000 | 1.33Cr
25.06L | 24,050 | 49.86L
85.40L | 24,100 (ATM) | 76.76L
39.76L | 24,150 | 16.06L
84.01L | 24,200 | 31.79L
32.43L | 24,250 | 4.04L
81.18L | 24,300 | 13.08L
Highlighted rows:
Yellow = ATM strike.
Red CE OI = strong call-side concentration.
Green PE OI = strong put-side concentration.
3.3 PCR — Put-Call Ratio
PCR (OI-based) is a widely used sentiment indicator in options trading.
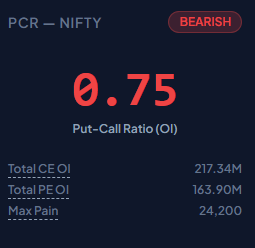
PCR < 0.8
BEARISH BIAS PCR 0.85–1.15
NEUTRAL ZONE PCR > 1.2
BULLISH BIAS Today's PCR = 0.977 — NEUTRAL. PCR should be interpreted together with price action, volatility, and OI structure rather than used in isolation.
Sitting right on the fence. Lean on the centroid and heatmap for directional bias rather than PCR alone.
4. How to Read It — Step-by-Step
Follow this 6-step process each time you open the dashboard to extract a structured directional framework:
Step 1 - Check the Centroid Signal Read BEARISH / BULLISH / NEUTRAL + Strength score. <40 = weak conviction; >70 = strong trend.
Step 2 - Identify Key Heatmap Walls Find strikes with heaviest CE OI (resistance) and PE OI (support) near ATM — these often behave as important intraday reaction zones.
Step 3 - Confirm ATM OI Balance Compare CE vs PE OI at ATM strike. Skewed CE = call-side positioning remains stronger above price; skewed PE = put-side positioning remains stronger below price.
Step 4 - Cross-check with PCR PCR <0.8 = bearish; PCR >1.2 = bullish; 0.85–1.15 = neutral. Use as confirmation, not primary trigger.
Step 5 - Monitor CE/PE Centroid Migration CE Centroid dropping or PE Centroid rising intraday signals changing market positioning that may influence short-term sentiment.
Step 6 - Refresh Post Key Events OI shifts sharply post-market open, post F&O data, and around economic announcements. Reload at inflection points.
5. Key Practical Applications
This OI dashboard provides the following concrete edges over price-only analysis:
• Identify important OI-based support and resistance zones early — CE and PE concentration zones can influence intraday reactions and provide more data-driven reference levels.
• Avoid fakeouts and bull/bear traps by checking whether OI is building or unwinding at the breakout strike before committing.
• Assess relative market positioning strength through the Centroid Strength score — low strength means the market can flip fast; high strength means the trend is well-defended.
• Identify possible intraday range with the CE-PE Centroid Spread — tells you where market makers expect Nifty to oscillate before expiry.
• Read PCR as a real-time sentiment pulse — divergence between PCR and price can sometimes indicate weakening momentum or positioning imbalance.
• Find the path of least resistance using Heatmap asymmetry — if PE OI far outweighs CE OI below spot, the downside may appear comparatively better supported.
• React in real-time to OI shifts at ATM — sudden CE unwinding at ATM during a rally is a potential bullish indication; sudden PE unwinding at ATM during a fall is a possible weakness signal.
6. Common Intraday OI Scenarios
The five scenarios below represent the commonly observed OI-based setups from this dashboard:
01 - Breakout Confirmation via CE OI Wall If CE OI unwinds at a resistance strike during a breakout, the breakout may have stronger confirmation. If CE OI holds or increases, the breakout may lack strong OI confirmation.
02 - Trap Detection at PE OI Support If PE OI unwinds as price bounces off support, put-side support appears to be weakening — put-side support appears to be weakening. Traders should monitor whether support continues to hold. Exit before the next leg down.
03 - Range Trading with Centroid Spread Low Centroid Strength (<40) + stable CE-PE spread = oscillation range. Some traders may explore range-based strategies near the centroid zones during low-conviction market conditions, including range-based strategies such as iron condors.
04 - Expiry Max Pain Convergence OI centroid proximity to Max Pain can sometimes act as a reference zone during expiry sessions. Avoid being caught on the wrong side of expiry-day squaring.
05 - PCR Divergence as Reversal Signal Price making new highs while PCR declines may indicate bearish divergence. Price falling while PCR rises may indicate improving support conditions or a possible reversal attempt. Price falling while PCR rises may indicate improving support conditions or a possible reversal attempt.
7. What Makes This OI Tool Special vs. Traditional Price Indicators
Moving averages and RSI are lagging by definition — they reflect what has already happened. The OI dashboard tracks real-time changes in Open Interest positioning, helping traders observe evolving market structure alongside price action. The proprietary Centroid Engine distils thousands of individual OI data points into a single directional signal with a quantified strength score — simplifying large amounts of OI data into a structured view.
vs. Raw OI Data Raw OI tables require manual interpretation across dozens of strikes — time-consuming and error-prone. The Heatmap visualisation layer maps the full strike ladder instantly, so you see exactly where money is concentrated. The visualization helps traders interpret option chain data more efficiently, including patterns that may not be immediately visible on price charts alone.
Important Limitations of OI Analysis
• Open Interest reflects positioning activity, not guaranteed future direction. • Strong OI zones can break during high volatility or aggressive short covering. • PCR extremes may persist during trending markets. • OI should always be combined with price action, volume, and broader market structure. • No single OI signal guarantees a successful trade outcome. • Risk management and stop-loss discipline remain essential.
8. Next Steps — Put OI to Work
You now have a structured framework for interpreting live OI data. Here is how to apply it immediately:
- Upload your current OI dashboard or a fresh PDF screenshot — correlate the heatmap, centroid, and PCR concepts live against real price action.
- Ask about specific concepts deeper — e.g. 'Explain CE/PE wall dynamics' or 'How do I use PCR divergence for entries?'
- Drop a price chart alongside the OI dashboard — map OI levels directly onto price action and identify important positioning shifts across key strikes.
- Practice the 6-step reading process on each market open until it becomes instinct.
- Monitor the centroid migration throughout the day — the first intraday shift in centroid direction can sometimes provide useful insight into changing market positioning.
Use these concepts with discipline, price action confirmation, and proper risk management.
StockAiVerse — Live OI Dashboard | stockaiverse.com/oitech/dashboard