

OI Tech OI viewer PCR
Open Interest Intelligence for Nifty Intraday Traders Powered by StockAiVerse | OI Dashboard Reference Guide
1. OI Tech Snapshot
The OI Tech dashboard is your real-time window into the hidden mechanics of the Nifty options market. Unlike price charts that show you where the market has been, this tool reveals where smart money is positioned right now. It aggregates Put-Call Ratio (PCR), PCR Diversion, and OI tick data into one unified view, giving sharp intraday traders a decisive edge over those relying on lagging price indicators alone.
2. What It Shows — Core OI Intelligence
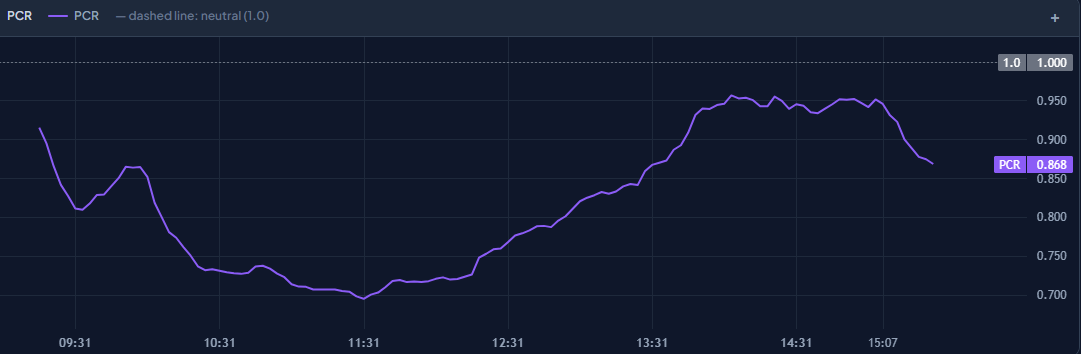
PCR (Put-Call Ratio) Line Chart
The main PCR chart plots the real-time ratio of Put OI to Call OI throughout the session. The dashed neutral line at 1.0 is your baseline. PCR trending below 1.0 signals Call-heavy positioning (bearish lean by options writers); above 1.0 signals Put-heavy positioning (bullish lean). The chart captures the full session arc from the anchor snapshot (J1) to the current moment (J2), so you track sentiment evolution — not just a static number.
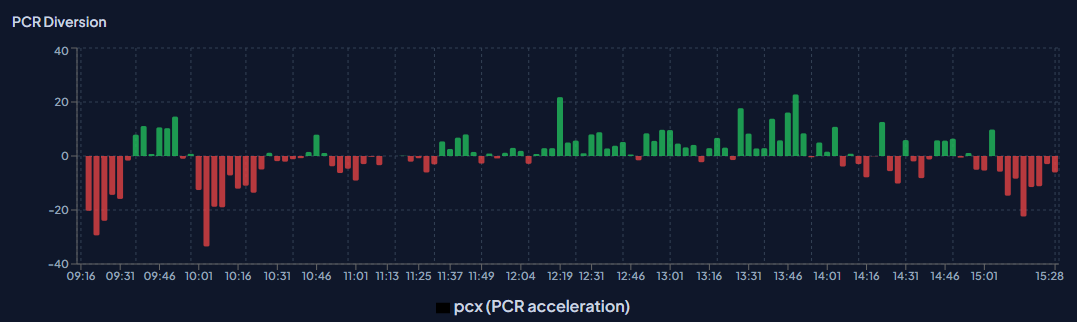
PCR Diversion Histogram
This bar chart breaks down PCR change tick-by-tick, colour-coded to show PCX (PCR acceleration). Each bar represents a snapshot interval. Bars above the axis = PCR expanding bullishly (Puts being added faster than Calls). Bars below = bearish PCR compression. This is your momentum gauge for OI flow — ideal for spotting acceleration phases before price reacts.
FLAT vs BULL Tick Counters These counters summarise market character across all snapshots taken during the session. FLAT ticks indicate periods where OI was building without a clear directional bias. BULL ticks count snapshots where the OI structure confirmed upward conviction. A dominant FLAT count signals a range day; a growing BULL count signals a trending session.
Snapshot Anchoring — J1 / J2 System The tool uses a two-snapshot comparison system: Anchor (J1) set at the first snapshot of the day and Current (J2) at the latest update. This delta-based approach filters out pre-market noise and tracks net OI change from a stable reference point, giving a cleaner read on real session conviction than absolute OI numbers alone.
Total OI, Delta OI & PCR Summary Bar At the top of the dashboard, Total OI and delta OI (net change) give an instant pulse on whether new positions are being created or old ones closed. The current PCR is displayed here as a headline number. Spike indicators flag any sharp OI spike events — the critical signals for fakeout and trap detection.
3. Why You Will Love It — Key Trading Edges
• See the market's true bias — not just price direction. PCR trending away from 1.0 before a major candle confirms institutional intent, not retail chasing.
• Catch fakeouts before they trap you. A bearish price bar paired with bullish PCR expansion is the classic fakeout fingerprint — the dashboard shows it in real-time.
• Use FLAT tick count as a range filter. High FLAT counts early in the session means avoid momentum strategies until OI structure breaks decisively.
• Time your entries with PCR Diversion. Accelerating PCX bars in the direction of your bias equals high-conviction continuation; decelerating bars mean wait or reduce size.
• Cut through noise with anchor-based delta. Comparing current OI to the day's opening baseline strips out pre-market positioning and shows what is really happening right now.
• Validate every breakout with OI confirmation. Price breaking a key level with rising OI in the move's direction equals a real breakout. Price breaking without OI support equals a trap.
• Build a session narrative. Watching PCR evolve from open to current time gives you the full story of how smart money repositioned across the day.
4. How to Read It — Step-by-Step
- Step 1 — Check the PCR Summary Bar. Note the current PCR and compare it to 1.0. Call-heavy (<1) or Put-heavy (>1)? This sets your session bias baseline immediately.
- Step 2 — Read the PCR Line Chart slope. Is the line trending up (bullish PCR expansion), down (bearish compression), or flat (neutral)? The slope and acceleration matter more than the absolute level.
- Step 3 — Scan the PCR Diversion bars. Look for clusters of same-direction bars (sustained OI flow) vs alternating bars (chop). PCX acceleration in one direction equals momentum confirmation.
- Step 4 — Check the FLAT vs BULL ratio. High FLAT count relative to directional ticks means range day — adjust strategy. Low FLAT plus high BULL means trending session with momentum.
- Step 5 — Watch for OI Spike alerts. Upward spikes with price moving up equal real breakout fuel. Downward spikes at resistance equal trap alert. Zero spikes on a quiet session means reduce position size.
- Step 6 — Cross-reference with Nifty price action. Always overlay OI signals on your spot chart. OI divergence from price equals high-probability reversal or trap. OI confirmation with price equals trade with conviction.
5. High-Probability Intraday Use Cases
Use Case 1: Fakeout Detection at Key Levels Price breaks above resistance with a strong bullish candle — retail traders rush to buy. But PCR is actually declining (Calls being added faster than Puts), and Diversion bars are red. This OI-price divergence is the classic fakeout fingerprint. The dashboard shows you the trap in real-time, letting you fade the breakout or avoid the long entirely and protect your capital.
Use Case 2: Momentum Confirmation for Trend Entries PCR has been steadily climbing above 1.0 since the open, with consistent bullish Diversion bars and minimal FLAT ticks. Price pulls back to VWAP or a prior support level. This is the OI-backed re-entry setup — the pullback is in a structurally bullish session, confirmed by sustained Put writing. Enter long with confidence knowing OI structure is supporting your trade.
Use Case 3: Range-Day Identification FLAT ticks dominate the counter. PCR Line Chart hovers near neutral with no clear slope. PCR Diversion bars are small and alternating. This is your signal to avoid momentum trades entirely. Instead, structure range-based strategies: sell options at extremes, trade mean-reversion setups, or sit on hands until OI structure shifts decisively in one direction.
Use Case 4: Expiry-Day Gravitational Pull As expiry approaches, OI concentrates around specific strikes and the PCR Diversion bars show sharp PCX acceleration toward a particular level. This reflects options writers defending their maximum-profit position. The OI structure acts as a gravitational magnet — use it as your target for mean-reversion trades when price deviates too far in either direction from the concentration zone.
Use Case 5: Opening Drive Validation The first 5 to 15 minutes of the session often set the day's bias. Using J1 (anchor) versus early J2 snapshots, check if the opening PCR move is confirmed by OI buildup or if it is all price-driven with flat OI (a trap open). A genuine opening drive shows PCR and delta OI moving in alignment with price — that is the green light for a directional morning trade with full conviction.
6. What Makes This OI Tool Special
Most retail traders rely on lagging indicators — RSI, MACD, moving averages — that tell you what already happened. This OI dashboard shows live positioning of market participants in real-time, tick by tick, giving you a meaningful head start on price moves the crowd will not see coming. The anchor-based delta methodology cuts through opening noise and shows net session conviction rather than absolute OI numbers that mean nothing without context.
The combination of PCR trend line, Diversion histogram, and FLAT/BULL tick counters creates a multi-dimensional OI picture. No single indicator tells the full story — this tool layers them intelligently so you are reading the market's actual structural intent, not reacting to isolated signals. For Nifty intraday traders who want to stop getting trapped and start trading with the house, this is the edge that makes the difference on every session.
Next Steps
Ready to apply these OI concepts to your live charts? Upload your current OI dashboard — walk through the structure and get a real-time read of what the market is showing.
Want a deep-dive into a specific section — like reading PCR Diversion for momentum confirmation, or using FLAT ticks to filter range days? Just ask for the specific concept.
Drop any fresh Nifty OI dashboard and get a live walkthrough — concept by concept, trade setup by trade setup, every session.