

K9 SECTORIAL INDICES Tree Map
Activity-Based Market Intelligence for Indian Equities
🚀 Product Snapshot
K9 Sectorial Indices is a smart, daily-updated market tool built for Indian stock market investors, traders, fund managers, and analysts. Instead of looking at how BIG a company is (like most indices do), K9 looks at how ACTIVELY money is flowing through it. This makes K9 one of the most honest and forward-looking sector trackers available for Indian equities today.
✨ What It Does (Super Simple)
Imagine you are trying to figure out which neighbourhoods in a city are getting popular — not just which ones are the most expensive, but which ones people are actually moving INTO right now. K9 does exactly this for the Indian stock market.
Every day, K9 measures how much real money is moving through 75+ different industries — things like Electrical Appliances, Diagnostic Chains, Fertilizers, IT companies, Banks, and many more. It gives each sector a daily score based on actual trading activity, not just company size.
The result? You can see, at a glance, which sectors are hot, which are cooling down, and where the smart money might be heading next.
🔥 Why You Will Love It (Key Benefits)
• You get to see where money is actually flowing every day — not just where it sat last quarter.
• You get to spot rising sectors BEFORE they make headlines, giving you an early-mover edge.
• This means you can identify when big fund managers are quietly buying into a sector, shown as sharp spikes in activity.
• You get to track 75+ industries separately — from Packaged Meat to Metal Pipes to Life Insurance — nothing is hidden in a bundle.
• This means you can avoid sectors where trading is thin or falling, protecting you from low-conviction moves.
• You get to see a fresh, recalibrated view every month, using the most recent 50 trading days — always current, never stale.
• This means you can read the broader market mood (bullish, defensive, wait-and-watch) just by looking at the dashboard.
📋 How It Works (Step-by-Step)
1. K9 looks at every company in an industry and calculates its daily Money Flow — that is Price multiplied by Volume, averaged over the last 50 trading days.
2. It then adjusts for Consistency — companies that trade steadily every day are valued more than those that spike randomly just once.
3. Each company gets an Influence Score — its share of the total trading activity in its industry.
4. All companies in a sector are combined using these weighted scores to produce the Sector Index for that day.
5. Every month, the weights are recalibrated using the freshest 50-day window, so the index always reflects current market reality.
6. The final dashboard shows every sector's index value, daily change percentage, and trading volume — all in one place.
💡 Simple Real-Life Use Cases
Use Case 1: Spotting a Sector Before It Runs
Priya is a retail investor who has been watching the Auto sector. She checks the K9 dashboard and notices Auto trading activity has jumped sharply over the past week, even though prices have not moved much yet. She recognises this as a potential early signal of a rally and takes a closer look. K9 helped her see the movement before the price reaction happened.
Use Case 2: Avoiding a Trap
Rahul is considering buying into a small NBFC stock because it looks cheap. He checks K9 and sees the NBFC Deposit sector is down -0.44% with falling activity — one of the few red sectors on the map. He decides to wait. K9 saved him from entering a sector where money is actually flowing OUT.
Use Case 3: Portfolio Rebalancing
Sunita manages a small fund. Every month when K9 recalibrates, she reviews which sectors have gained consistent trading strength over 50 days. She shifts a portion of her portfolio toward Electrical Appliances (+3.99%) and Alkali Chemicals (+3.91%), two of the strongest movers this week. K9 makes her rebalancing decisions data-driven and easy to justify.
Use Case 4: Reading Market Mood
Amit is trying to decide whether to increase his overall market exposure. He opens K9 and sees that Banking, Metals, and Auto are all rising together — a sign of broad bullish sentiment. He feels more confident adding positions. If instead he saw only Pharma and FMCG rising (defensive sectors), he would have held back. K9 tells him the story in seconds.
Use Case 5: Catching a Large Investor Move
Deepa notices an unusual spike in the Diagnostic Chains sector on K9 — activity jumped far above its normal level in a single day. She investigates and finds a large institutional investor quietly accumulating shares in the sector. K9 flagged the move before any news was published.
📊 Live Market Snapshot (April 27, 2026)
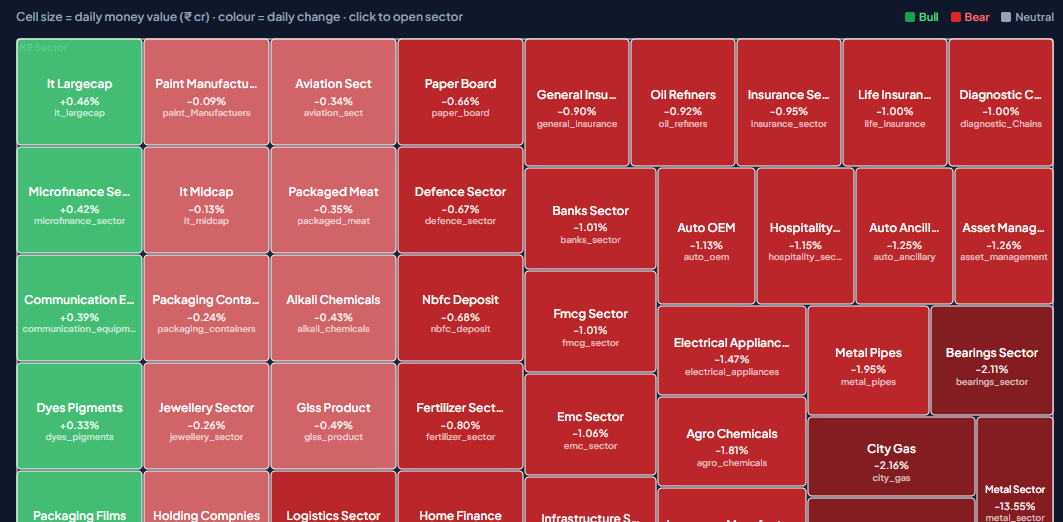
The K9 treemap below shows today's sector picture. Cell size = money value (₹ crore). Green = rising (Bull). Red = falling (Bear).
Sector | Index Value Change | Daily Volume
Electrical Appliances — +3.99% High
Alkali Chemicals — +3.91% High
Metal Sector — +2.92% High
IT Midcap — +2.87% Medium
Packaged Meat — +2.52% Medium
EMC Sector — +2.53% Medium
Hospitality Sector — +2.40% Medium
Auto Ancillary — +2.23% Medium
IT Largecap — +2.05% High
Diagnostic Chains — +2.07% Medium
Banks Sector — +1.09% High
Life Insurance — +1.11% Medium
Insurance Sector — +1.12% Medium
FMCG Sector — +0.46% High
Oil Refiners — +0.08% Low
NBFC Deposit — -0.44% Low
Innerwear Manufacturers — -2.63% Low
🧭 How to Read the Market with K9
Banking + Metals + Auto rising → Broad bullish sentiment. Good time to increase exposure.
Pharma + FMCG rising, others flat → Defensive mood. Investors are being cautious. Tread carefully.
One sector spikes, others quiet → Sector-specific move or large investor buying. Investigate!
Activity rising across ALL sectors → Broad market rally may be coming. Consider adding positions.
Activity falling everywhere → Wait-and-watch mode. Low conviction. Stay on the sidelines.
🌟 What Makes K9 Special
K9 is the only Indian sectorial index system that is built entirely on trading ACTIVITY rather than company SIZE. This means it captures where real money is moving — not just where large companies happen to sit. The monthly recalibration keeps it current, the 75+ separate industries keep it specific, and the daily dashboard makes it immediately usable for any investor, from a beginner to a fund manager.
⚡ Next Steps
• Visit stockaiverse.com to explore the live K9 dashboard.
• Browse the treemap daily to build intuition about sector flows.
• Follow @stocktech for updates, signals, and sector alerts.
• Use K9 alongside your existing research to make smarter, activity-informed investment decisions.
stockaiverse.com | K9 Sectorial Indices | 2026