

OI Tech OI+ Pcr variation
Nifty Options Chain OI Dashboard — Deep Technical Analysis StockAiVerse | 28 April 2026 | Snapshot: 09:16 → 14:19 | 102 Snapshots
🚀 OI Tech Snapshot
The OI dashboard on StockAiVerse is a real-time intelligence layer that sits on top of your Nifty options chain — aggregating Open Interest buildup patterns, ATM premium decay, PCR skew, and strike-level conviction into a single, trader-facing view. It is engineered for sharp intraday Nifty options traders who want to read actual market intent behind price moves rather than reacting to lagging price-based indicators. Whether you trade directional premium, straddle decay, or range-bound iron condors, this dashboard hands you the OI X-ray that most retail traders never see.


✨ What It Shows — Core OI Intelligence
The dashboard is structured around two primary intelligence modules, visible in the uploaded snapshot from 28 April 2026 (used here as a visual reference for any trading day):
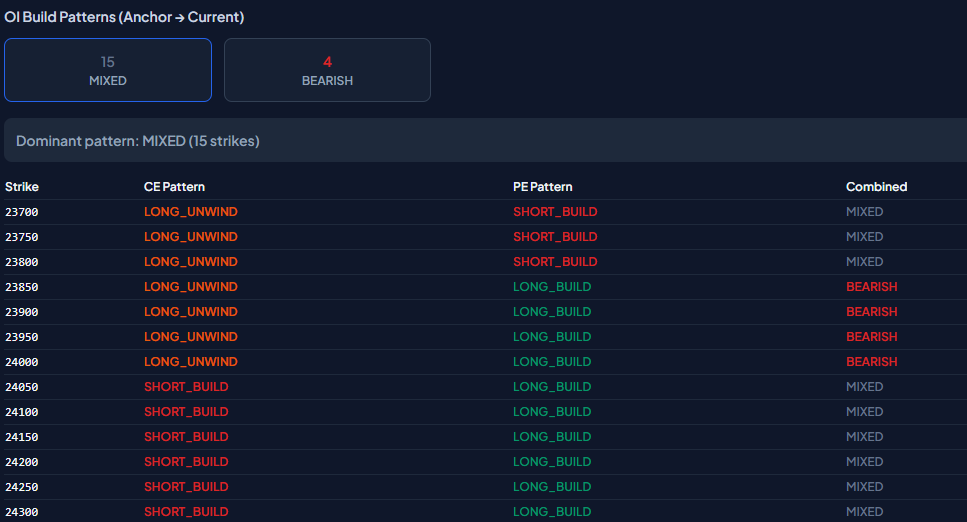
OI Build Patterns (Anchor → Current)
Compares the first-of-day snapshot (Anchor J1 at 09:16) against the latest snapshot (J2 at 14:19) across every strike from 23550 to 24500. For each strike it classifies CE and PE OI changes into four canonical states:
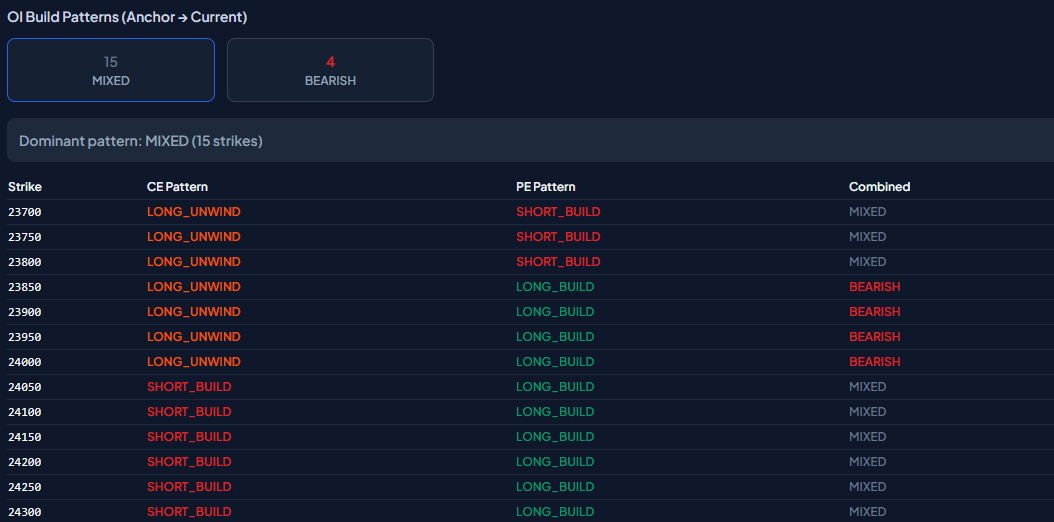
• SHORT_BUILD — rising OI with falling/flat premium → fresh short positions (writers adding risk)
• LONG_BUILD — rising OI with rising premium → fresh long positions (buyers adding conviction)
• SHORT_COVER — falling OI with rising premium → shorts covering, potential reversal signal
• LONG_UNWIND — falling OI with falling premium → longs exiting, loss of bullish momentum
The Combined column then classifies each strike as RANGEBOUND (both sides short-building → market locked in a band) or MIXED (divergent CE/PE behavior → directional interest or unwinding at that strike).
ATM Premium — Anchor vs Current
Tracks the straddle (CE + PE combined premium) at the ATM strike for both snapshots. This is your real-time theta-decay and volatility-compression monitor. When the straddle shrinks faster than expected, IV is collapsing and premium sellers are winning. When it holds or expands despite time passing, smart money is buying protection — a directional move may be loading.

🔥 Why You'll Love It — Key Trading Edges
• identify the precise range where market makers have written the most risk — the SHORT_BUILD zone defines your no-trade band with high confidence. You get to
• spot when the range is about to break — a sudden LONG_BUILD or SHORT_COVER cluster at boundary strikes telegraphs a breakout before it shows on price charts. This lets you
• monitor ATM straddle decay in real time — knowing whether premium is decaying normally or resisting tells you if a big move is loading or if the day is a theta-grind. You get to
• avoid fakeouts and traps — when price approaches a SHORT_BUILD wall but OI isn't unwinding, it's almost certainly a stop-hunt, not a genuine breakout. This lets you
• track 102 intraday snapshots to see how conviction has shifted across the session, not just the point-in-time snapshot most traders rely on. You get to
• calibrate entry timing precisely — entering after OI confirmation (not just price action) dramatically improves your win rate on premium trades. This lets you
📋 How to Read It — Step-by-Step
1. Step 1: Start with the Dominant Pattern summary.
Check the aggregate: RANGEBOUND (11 strikes) vs MIXED (9 strikes). A heavy RANGEBOUND score signals that writers are dominant and the market is compressed. The higher the RANGEBOUND count, the tighter the expected range.
2. Step 2: Identify the boundary strikes between RANGEBOUND and MIXED zones.
In this dashboard, strikes 23550–24050 are fully RANGEBOUND. Starting at 24100, patterns shift to MIXED. This boundary is your dynamic range ceiling — watch price behavior carefully when it approaches 24100–24150 intraday.
3. Step 3: Read CE and PE patterns independently before combining.
Note that all strikes show SHORT_BUILD on CE side throughout. This means call writers are uniformly adding positions across the entire range — a classic ceiling. The PE side tells a more nuanced story: SHORT_BUILD in the lower band (strong floor), transitioning to SHORT_COVER and LONG_BUILD above 24100 (buyers stepping in above range).
4. Step 4: Analyze the ATM Premium Decay table.
The straddle dropped from ₹116.5 (09:16) to ₹48.8 (14:19) — a 58.1% decay in under 5 hours. This is aggressive theta bleed consistent with a tight range day. CE premium fell 55.8% and PE premium fell 59.8%. The slight PE premium decay edge suggests a mild bearish drift (ATM shifted from 24050 to 24000, down 50 points from open).
5. Step 5: Correlate OI pattern with current price position.
With Nifty at approximately 24000 (ATM at 14:19), the market is sitting at the bottom of the SHORT_BUILD zone. PE SHORT_BUILD below 24000 means strong put writer support. CE SHORT_BUILD above means a hard ceiling. Classic pin-to-ATM dynamics are in play — premium sellers are in full control.
6. Step 6: Use snapshot count to gauge conviction strength.
With 102 snapshots captured across the day, each OI reading has been validated across multiple intraday cycles. The longer SHORT_BUILD persists across snapshots at the same strike, the more institutionally anchored that level is.
💡 High-Probability Intraday Use Cases
Based on the OI dashboard structure shown in this snapshot, here are the five most actionable general-use trading scenarios this tool enables:
Use Case 1: Selling the Range — Intraday Iron Condor Setup
When the dominant pattern is RANGEBOUND across a wide strike band, both CE and PE are SHORT_BUILD simultaneously — meaning writers are confident the market stays within that corridor. You define your short strikes at the boundary of the RANGEBOUND zone (e.g., just above the MIXED transition on the call side, and the lowest SHORT_BUILD strike on the put side). The OI wall at both ends acts as your protective barrier. Exit or hedge only if the SHORT_BUILD converts to SHORT_COVER at the boundary — that's your stop-signal, not a price level.
Use Case 2: Breakout Confirmation — Avoiding the CE Wall Fakeout
All 20 strikes on the dashboard show SHORT_BUILD on the CE side. This is a hard call writer wall. When Nifty price approaches the upper range (near 24100–24150), retail momentum traders will see a "breakout" candle. This dashboard tells you the truth: unless CE OI starts unwinding (SHORT_COVER or LONG_UNWIND appearing at those strikes), the move is a fakeout. You either stay short CE or stand aside — no FOMO buys until OI confirms.
Use Case 3: PE Floor Identification — Buying Dips Intelligently
Below 24000, PE side is uniformly SHORT_BUILD — put writers are aggressively selling puts, acting as a synthetic support floor. This means on any sharp intraday dip toward 23800–23900, institutions are effectively "buying the dip" via put writing. For CE buyers or bull spread traders, this OI confirmation gives you a high-conviction entry zone without needing a separate support level from technical analysis.
Use Case 4: ATM Straddle Decay Trade — Timing Premium Selling
The 58% straddle decay observed from open to 14:19 with Nifty pinned near ATM is the ideal environment for intraday straddle sellers. When this dashboard shows RANGEBOUND dominant and ATM straddle is decaying at a linear or accelerating rate through the session snapshots, it confirms you're in a theta-grind day. Scale into the short straddle at the RANGEBOUND zone centre, and trail your exit using the snapshot-by-snapshot straddle level — not just time.
Use Case 5: Transition Zone Scalping — Reading MIXED Strikes
Above 24100, the PE pattern transitions from SHORT_BUILD to LONG_BUILD and SHORT_COVER alternately. This zone is not random — it represents areas where fresh long positions are being built on the PE side while CE writers continue to cap upside. This pattern typically creates short-duration directional pops (bullish scalp territory on dips to 24100 support) that quickly get sold back. Scalpers can use these MIXED strikes as their entry/exit band, treating LONG_BUILD PE strikes as momentary support and SHORT_BUILD CE strikes as resistance.
🌟 What Makes This OI Tool Special
Unlike standard OI charts or options chain views that show a single static reading, StockAiVerse captures 100+ intraday snapshots and classifies each strike dynamically — so you're reading OI conviction that has been validated across the full trading session, not just the last refresh. The Anchor-to-Current methodology eliminates opening noise and shows you only the meaningful OI shifts that occurred after the market found its intraday direction. Combined with real-time ATM straddle monitoring, it gives you both the structural range (via OI patterns) and the volatility state (via premium decay) in a single unified view — the two things a Nifty intraday trader needs most.
Next Steps
Ready to apply these OI concepts to your live charts? Here is what to do next: • Upload your next OI dashboard snapshot and ask for a real-time pattern read
• Ask for a deep-dive on any specific section — centroid migration, PCR skew, or heatmap visualization
• Correlate today's OI build with your existing price action chart for a combined edge
The market reveals its hand through OI — you just need the right lens to read it. 📍
Appendix — Raw Dashboard Data (28 April 2026)
OI Build Patterns — All Strikes Strike CE Pattern PE Pattern Combined
23550–24050 SHORT_BUILD SHORT_BUILD RANGEBOUND
24100 SHORT_BUILD SHORT_COVER MIXED
24150 SHORT_BUILD LONG_BUILD MIXED
24200 SHORT_BUILD SHORT_COVER MIXED
24250 SHORT_BUILD LONG_BUILD MIXED
24300 SHORT_BUILD SHORT_COVER MIXED
24350 SHORT_BUILD LONG_BUILD MIXED
24400–24450 SHORT_BUILD SHORT_COVER MIXED
24500 SHORT_BUILD SHORT_COVER MIXED
ATM Premium — Anchor vs Current
Snapshot CE Premium Straddle PE Premium

Anchor J1 (09:16) ATM 24050 ₹45.0 ₹116.5 ₹71.6
Current J2 (14:19) ATM 24000 ₹19.9 ₹48.8 ₹28.8
Decay (Anchor→Current) −₹25.1 (−55.8%) −₹67.7 (−58.1%) −₹42.8 (−59.8%)